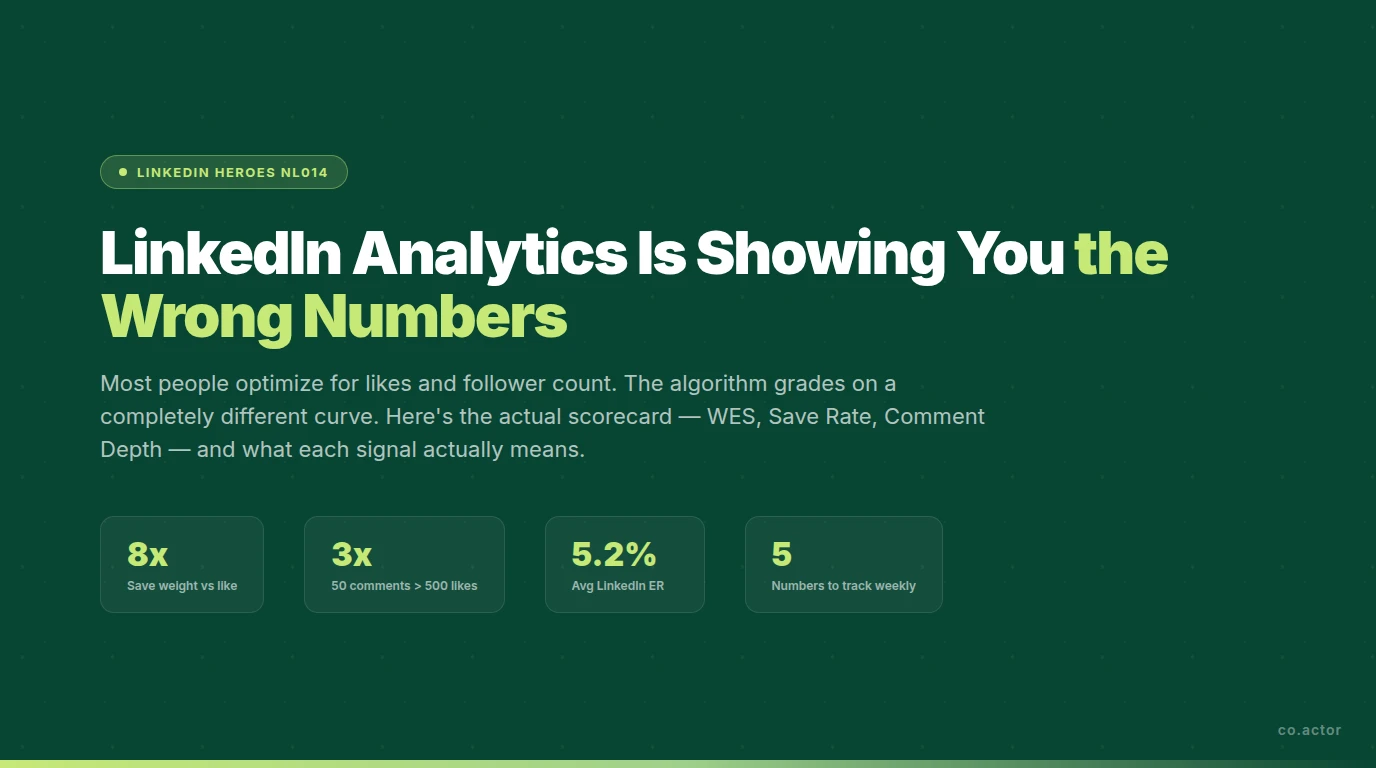
Most people check their LinkedIn Analytics, see impressions and likes, feel vaguely good or bad about the numbers, and move on. The problem: those numbers don't measure what the algorithm actually weights. You can have a post with 300 likes and declining reach. You can have a post with 8 comments and growing distribution. The difference isn't visible in standard analytics.
This article explains what to look for instead — and gives you the actual formulas. The previous two articles covered how 360Brew decides who sees your content and how to build your profile as an algorithmic signal. This is the third piece — how to tell whether any of it is working.
TL;DR — What This Article Covers
- 50 comments outperform 500 likes by 3x in algorithmic reach — engagement types are not equal.
- WES (Weighted Engagement Score) is the single number that mirrors what the algorithm actually values.
- Save Rate is the most predictive metric for extended distribution — 1 save = 5–8x a like.
- Comment Depth Ratio tells you whether you're generating discussion or reactions — 360Brew weights threaded conversations far above isolated comments.
- Your metrics are diagnostic signals, not scores — each pattern of rises and falls tells you something specific to fix.
The Wrong Scoreboard
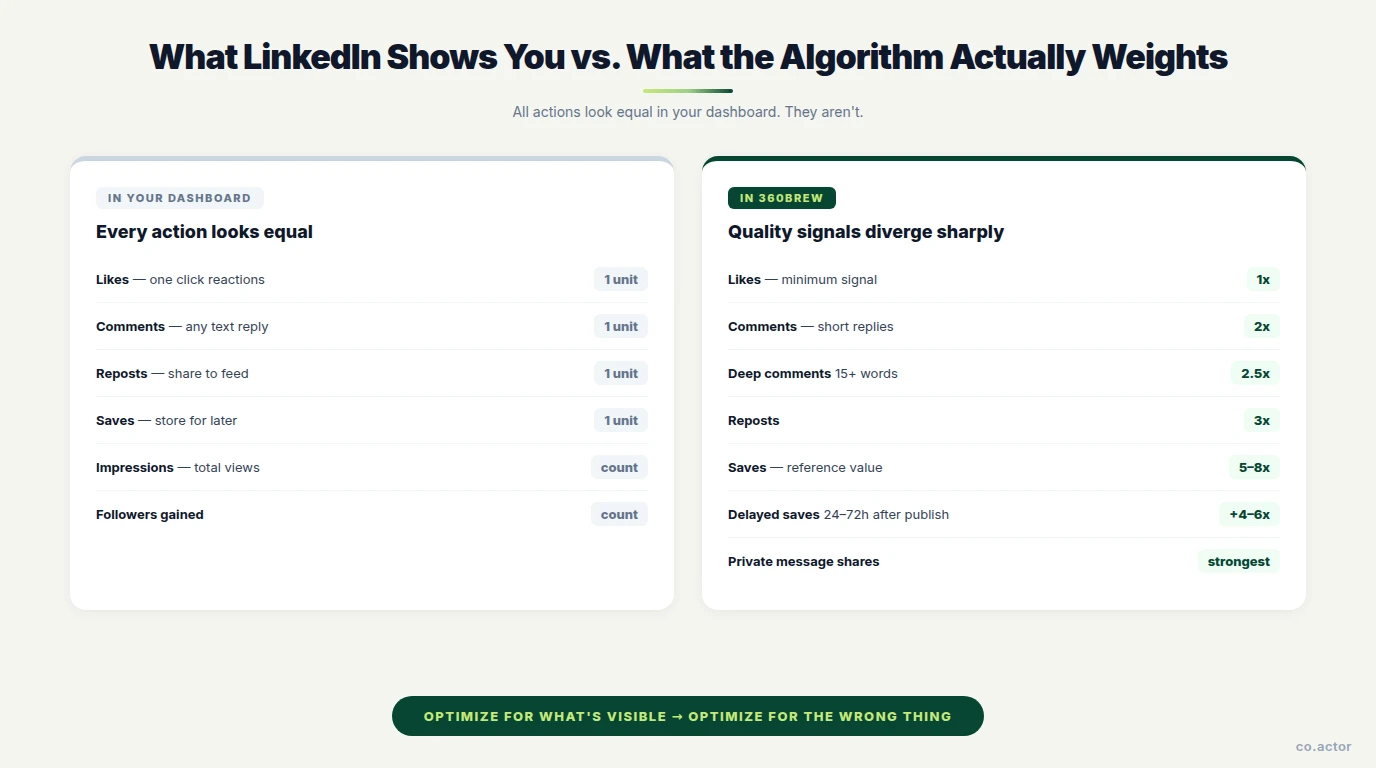
LinkedIn Analytics gives you six numbers by default: impressions, unique views, reactions, comments, reposts, and followers gained. These are the numbers most people optimize for.
Here's the problem: the algorithm doesn't grade on this curve.
LinkedIn's AI weights engagement types completely differently than what the analytics dashboard presents. A like and a save appear as equal units in your analytics total. They are not equal. A like carries the minimum algorithmic weight of any engagement action. A save carries 5–8x that weight — and a delayed save (24–72 hours after posting) carries 4–6x the weight of an immediate one. One genuine back-and-forth thread between two commenters carries more distribution weight than twenty isolated "great post!" reactions.
When you optimize for what the dashboard shows, you optimize for the wrong thing. Your content strategy gets shaped by the metrics you can see — and the metrics you can see don't reflect the metrics that actually determine your reach.
The metrics in this article won't appear in your LinkedIn Analytics tab. But they're the ones the algorithm is running on every post you publish.
Why All Engagement Isn't Equal
Before the formulas, the principle.
LinkedIn's algorithm is designed to answer one question: does this content deserve wider distribution? To answer that, it needs to distinguish between engagement that signals real value and engagement that doesn't.
A like is effortless. It takes one click and communicates almost nothing about whether the post was worth reading. A like from someone who quickly scrolled past is treated as a weak signal.
A save is different. It requires intention. Someone looked at your post, decided it was worth returning to, and stored it for later. The algorithm interprets a save as evidence of reference value — the kind of content that gets pulled up on someone's phone six days later when they actually need to do the thing it describes. That's a strong signal of genuine quality.
A deep comment — 15 or more words, adding perspective or context — signals that your post made someone think enough to write a response. When that comment generates a reply from another commenter, and that reply gets a response, you have thread depth: the signal 360Brew weights most heavily in the comment category. Back-and-forth conversations between readers indicate that your post created professional discussion, not just a reaction.
Private message shares are the strongest signal of all. When someone DMs your post to a colleague, it means the content was relevant enough to forward. These don't appear in public engagement counts. The algorithm sees them anyway.
WES: The Weighted Engagement Score
Standard Engagement Rate treats all actions as equal: total actions divided by impressions. It's a useful baseline — the LinkedIn-wide average in 2026 is 5.2%, personal profiles average 3.85%. Consistently below 2% means something is wrong. Above 6% means your content is performing well. But two posts can have the exact same engagement rate while generating completely different algorithmic outcomes — because ER doesn't account for what kind of engagement happened.
The Weighted Engagement Score adjusts for this. Each action gets a multiplier that reflects its algorithmic weight:
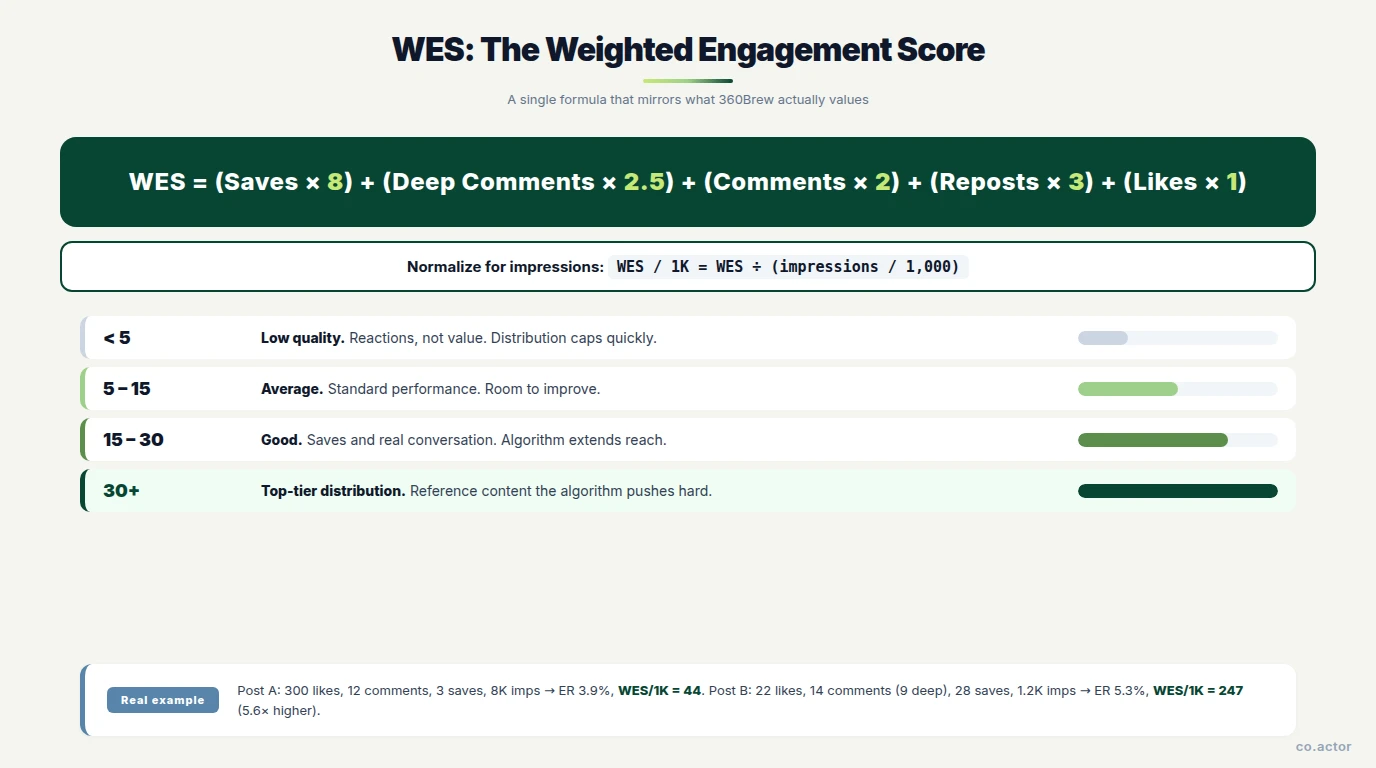
The formula: WES = (Saves × 8) + (Deep Comments × 2.5) + (Comments × 2) + (Reposts × 3) + (Likes × 1)
The weights reflect the signal hierarchy: saves and private shares at the top, deep comments in the middle, likes at the bottom. Add them up and you get your WES.
Raw WES isn't comparable across posts with different impression counts — a post with 10,000 impressions will naturally accumulate more engagement than one with 1,000. Divide WES by impressions per thousand to normalize it.
- Under 5 — low engagement quality. Reactions, not value.
- 5 to 15 — average. Standard performance.
- 15 to 30 — good. Saves and real conversation. Algorithm extends reach.
- Above 30 — top-tier algorithmic distribution territory.
A Real Example
Post A looks like a success: 300 likes, 12 comments, 3 saves, 8,000 impressions. Standard ER is 3.9%. WES/1K: 44.
Post B looks modest: 22 likes, 14 comments (9 of them deep threaded discussions), 28 saves, 1,200 impressions. Standard ER is 5.3%. WES/1K: 247.
Post B's quality-adjusted score is 5.6x higher. Despite fewer total impressions, the algorithm sees it as dramatically better content and extends its distribution. Post A gets capped. Most people would call Post A the better post. The algorithm disagrees.
Save Rate: The Single Best Predictor
If you track only one metric from this article, make it Save Rate: your total saves divided by your impressions.
- Under 0.5% — your content isn't save-worthy. No reference value.
- 0.5% to 1% — average.
- 1% to 2% — good. People are storing your content to use later.
- Above 2% — your content functions as a reference document.
Why this metric outpredicts everything else: a save tells the algorithm something that no other engagement signal can — this post was worth coming back to. Delayed saves (those that happen 24–72 hours after publishing) are weighted 4–6x more heavily than immediate ones. Someone who opens a post six days later when they actually need the framework it describes is sending an unambiguous quality signal.
The practical save test
Content that drives saves: step-by-step processes with a defined output, decision frameworks, checklists with specific criteria, templates, stat-dense reference material someone will cite in a meeting.
Content that generates likes but not saves: hot takes, personal stories without an extractable lesson, questions that prompt comments but offer no actionable answer, reaction posts to trending news.
A post that generates discussion immediately but no saves is valuable for community engagement but weak for long-term algorithmic momentum. A post with a 2% save rate and modest comment volume will outperform it for extended reach.
Comment Depth Ratio: Discussion or Reactions?
Standard analytics show total comment count. The algorithm cares about something different: whether those comments are conversations.
Comment Depth Ratio is the percentage of your comments that are replies to other commenters — not just replies to you. Count the back-and-forth exchanges in your comment section, divide by total comments.
- Under 20% — isolated reactions. People comment, no one responds.
- 20% to 40% — normal discussion.
- 40% to 60% — active discussion. Strong algorithmic signal.
- Above 60% — deep discussion. Top-tier for 360Brew's thread-depth weighting.
Thread depth is a relatively new high-weight signal. A post where ten people each leave an isolated "interesting perspective" comment is algorithmically weaker than a post where five people get into a genuine back-and-forth debate. The algorithm is measuring whether your content creates professional discussion — not just whether people feel vaguely positive about it.
Below 20% consistently means your posts generate reactions but not debates. The fix isn't "agree or disagree?" — engagement bait is algorithmically penalized. It's making a specific, contested claim that people who know the topic will genuinely disagree about. Real disagreement, backed by experience and specifics, generates the thread depth that moves the needle.
Your response strategy matters here too. When you reply to a comment with a substantive follow-up question instead of "thanks!" you seed the next turn of the conversation. Reply within 15 minutes, add a real thought, ask something specific.
The Decision Framework: What Your Numbers Are Telling You
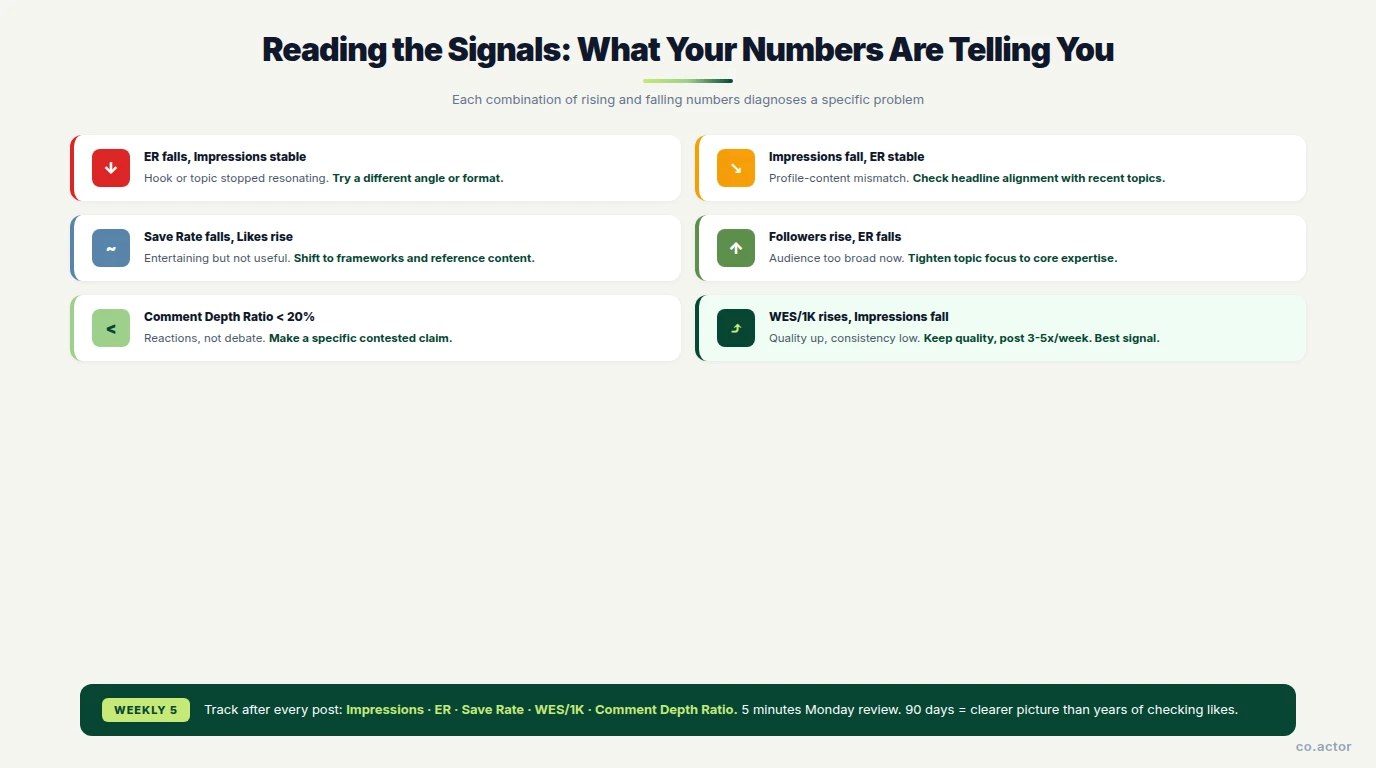
Metrics aren't scores. They're diagnostic signals. Each combination of rising and falling numbers tells you something specific about what's broken and what to fix.
When Engagement Rate Falls but Impressions Stay Stable
Your content is getting seen but not connecting. The hook, the topic, or the format has stopped resonating. Try a different angle on the same topic, test a different format, or check whether your audience has simply heard this already.
When Impressions Fall but Engagement Rate Stays Stable
Your content quality is fine — the algorithm has narrowed your distribution. First check: does your profile still match your content topics? A misaligned headline after a topic shift causes exactly this pattern. Second: are you active in your niche's comment sections? Comment activity in the first hour after publishing correlates with a 20% reach increase.
When Save Rate Falls While Likes Rise
Your content is entertaining but not useful. People enjoy reading it; they don't need it later. Shift your next 3–4 posts toward frameworks, processes, and reference material. Add a "save this when you need to..." CTA.
When Follower Count Rises but Engagement Rate Falls
You're attracting a broader audience than your niche. Your new followers are interested in you generally, not in the specific topic that made them follow. The algorithm sees weaker engagement relative to your growing audience size and pulls back distribution. The fix: tighten your topic focus, return to the core expertise that built your initial engaged base.
When Comment Depth Ratio Falls Below 20%
Your community isn't debating your content — they're acknowledging it. Shift from observation posts to posts that take a clear, specific position that practitioners in your field would reasonably disagree with.
When WES/1K Rises While Impressions Fall
This is the most counterintuitive pattern — and one of the best signals. Your content quality is improving, but you haven't yet built enough posting consistency for the algorithm to expand distribution. Keep the quality, increase frequency to 3–5 posts per week, and comment actively in your niche.
When Profile Views Spike but Followers Don't Convert
People are clicking through to your profile and leaving. Profile problem, not a content problem. Run the 90-day audit from the previous article.
What to Track Weekly
Five numbers. Logged within 48 hours of each post. Five minutes every Monday to review.
- Impressions from LinkedIn Analytics
- Standard ER (total actions divided by impressions)
- Save Rate (saves divided by impressions)
- WES/1K using the formula above
- Comment Depth Ratio counted manually in the comments section
Each Monday: which post had the highest WES/1K and what made it different? Is Save Rate trending up or down week over week? Are discussions getting deeper or shallower? Any post that dramatically over- or under-performed on standard ER — what does WES/1K say about why?
In 90 days of tracking these five numbers, you'll have a clearer picture of what your content actually does than most people get from years of checking likes.
Action Items: Apply This Week
- Calculate WES for your last three posts. Saves × 8, deep comments × 2.5, any comments × 2, reposts × 3, likes × 1. Add them up. Divide by impressions/1,000. This single number will reframe how you evaluate your recent content.
- Check your Save Rate in LinkedIn Analytics. Find saves, divide by impressions. Consistently below 0.5% means your next four posts should be frameworks, checklists, or reference material — not takes or opinions.
- Count Comment Depth Ratio on your last five posts. How many comments are replies to other commenters vs. total comments? Below 20% means your next post needs a more specific, genuinely contested claim.
- Identify your best post by WES/1K, not by likes. It might not be the post that felt most successful. What made it different? That's your signal for what to write more of.
- Set up a simple post log. A spreadsheet. Five columns: impressions, ER, save rate, WES/1K, comment depth ratio. Fill it in after each post. In 90 days, you'll see the patterns clearly.
Frequently Asked Questions
Why is LinkedIn Analytics showing the wrong numbers?
LinkedIn Analytics treats every action as one unit. The 360Brew algorithm weights them differently: a save carries 5 to 8 times the algorithmic weight of a like, deep comments outweigh short ones by 2.5x, and private message shares are the strongest signal of all. When you optimize for what the dashboard shows, you optimize for the wrong thing.
What is the Weighted Engagement Score (WES) formula?
WES = (Saves × 8) + (Deep Comments × 2.5) + (Comments × 2) + (Reposts × 3) + (Likes × 1). Normalize by impressions: WES per 1K = WES ÷ (impressions ÷ 1,000). Below 5 means low quality, 5-15 average, 15-30 good, above 30 top-tier algorithmic distribution territory.
What is a good LinkedIn save rate in 2026?
Under 0.5% — content has no reference value. 0.5%-1% — average. 1%-2% — good, people are storing for later. Above 2% — content functions as a reference document, the strongest possible quality signal for the algorithm.
How does Comment Depth Ratio work?
Comment Depth Ratio is the percentage of comments that are replies between commenters, not just replies to you. Under 20% means reactions only. 20-40% normal discussion. 40-60% active discussion (strong signal). Above 60% deep discussion — top-tier for 360Brew thread-depth weighting.
Why are saves more important than likes on LinkedIn?
A like is effortless and signals almost nothing. A save requires intention — someone decided your content was worth returning to. The algorithm interprets saves as evidence of reference value. Delayed saves (24-72h after publishing) are weighted 4-6x more heavily than immediate ones.
What does it mean when impressions fall but engagement rate stays stable?
Your content quality is fine — the algorithm narrowed your distribution. Most common cause: profile-content mismatch from a misaligned headline after a topic shift. Second most common: low activity in your niche's comment sections. Comment activity in the first hour after publishing correlates with a 20% reach increase.
How often should I check LinkedIn metrics?
Track five numbers within 48 hours of each post: impressions, standard ER, Save Rate, WES per 1K, and Comment Depth Ratio. Spend five minutes every Monday reviewing them. Over 90 days you will see patterns clearly.
Track What Actually Moves the Needle
Serge Bulaev is the CEO and founder of Co.Actor, a LinkedIn growth platform for B2B founders and their teams. He writes about content systems, profile positioning, and how the LinkedIn algorithm actually rewards modern creators.
Sources
- LinkedIn Algorithm Insights Report 2025 — Richard van der Blom (1.8M posts)
- SocialInsider — LinkedIn Organic Benchmarks 2026
- AuthoredUp — How the LinkedIn Algorithm Works (3M+ posts)
- LinkedIn Engineering Blog — Engineering the Next Generation of LinkedIn's Feed
- 360Brew: A Decoder-only Foundation Model for Personalized Ranking
Related Reading
- LinkedIn Algorithm 2026: What 360Brew Actually Rewards
- LinkedIn Profile Strategy 2026: Make Your Profile Work With the Algorithm
- The LinkedIn Content Engine: Build a Repeatable System Without Burning Out
- The Viral LinkedIn Post Formula: Data-Backed Framework for 2026
- How to Use AI for LinkedIn Content Without Sounding Like AI
Written by
